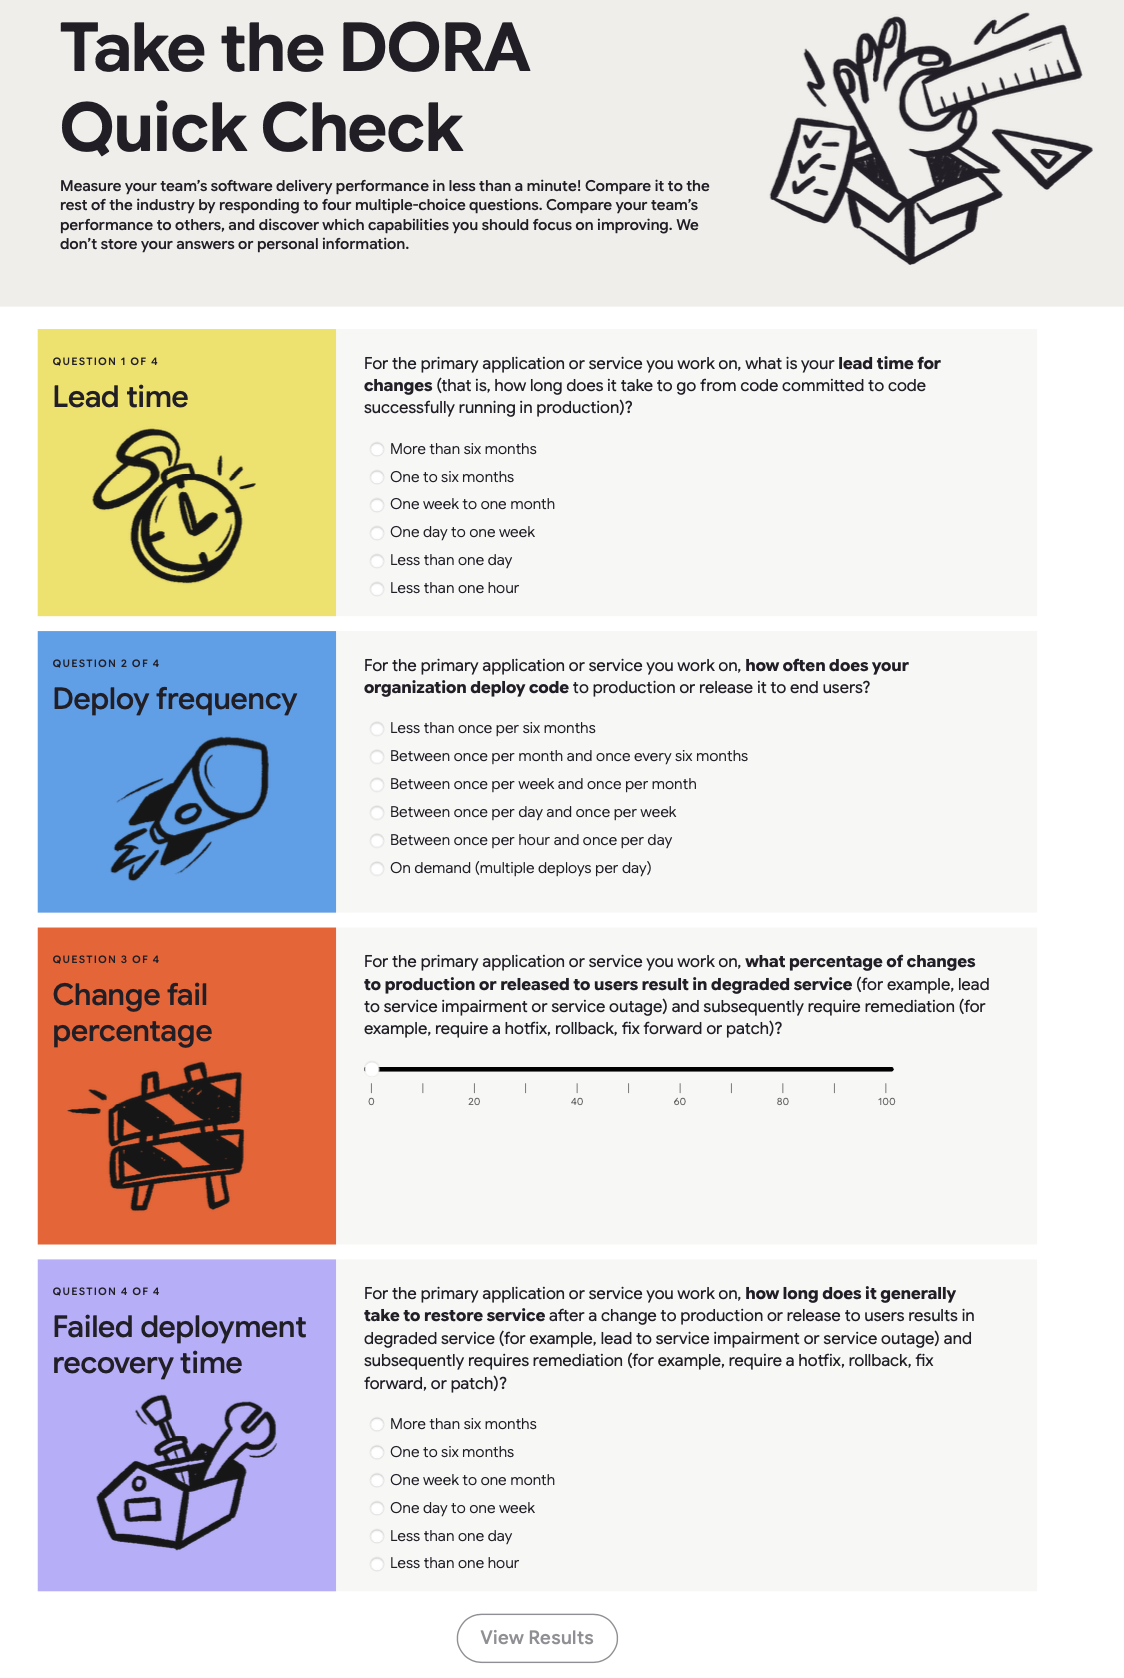
This started as homework: pick a real survey, find one flaw, go deep. It ended somewhere I did not expect — inside a tool I have actually used at work, and inside a tradeoff between depth and coverage that I make in my day job every week.
Almost everyone has stalled on a radio-button list where two options were both true. You know your answer. You just cannot find the box that holds it. So you guess at what the person who wrote the question probably meant, pick one, and move on — and your guess quietly becomes data.
Now imagine that list is four questions long, takes under a minute, and produces a score your team gets compared against the rest of the industry.
Write a short critique (1-2 double-spaced pages, about 600-1200 words) of a survey, survey question, poll, or interpretation of a survey. Each critique should: 1. Focus on one particular aspect or issue of the report in depth, rather than many aspects lightly, and 2. Focus on a specific aspect of survey methodology covered in the course.
A closed-ended question should offer response categories that are mutually exclusive (no value fits two options) and collectively exhaustive (every value fits one). Break the first rule and the respondent stops reporting and starts interpreting.
I chose the DORA Quick Check — Google’s four-question instrument for measuring software delivery performance. Not a survey I found while hunting for a target. One I had already taken, at work, without reading it as a survey at all.
I should own my own blind spot first. I have spent years being handed categories that did not quite fit and being expected to pick one anyway — forms that want a nationality when the honest answer is a sequence of them, drop-downs where my name does not survive the character limit. When you have had enough practice at that, you stop noticing the seam. You just pick the closest box, the way you learn to pick the closest available word mid-sentence. It took an assignment telling me to read an instrument as an instrument before I looked at a tool I had used repeatedly and saw that it had asked me to guess.
The setup
The pitch is right there in the header: measure your team’s software delivery performance in less than a minute. Four multiple-choice questions, no stored answers, no personal information. It covers the four metrics the DevOps research program is known for:
- Lead time for changes — commit to running in production
- Deploy frequency — how often code reaches users
- Change fail percentage — a 0–100 slider
- Failed deployment recovery time — how long to restore service
Your categorical answers get converted into a normalized performance score, which teams then use to guide improvement efforts, capability investment, and DevOps maturity work. That is the part worth holding onto: this is not a curiosity quiz. Its output gets pointed at budgets.
Throughput
How fast you ship
01 Deployment frequency
How often you release to production — on-demand and many times a day, or once every several months.
02 Lead time for changes
Commit to running in production — less than a day at the top, more than a month at the bottom.
Stability
How well it holds
03 Change failure rate
Share of releases that need a fix — rollbacks, hotfixes, patches, the deploys that didn't hold.
04 Failed-deployment recovery
Time to restore after a bad change — under an hour, or a scramble measured in weeks.
Three of those four questions ask you to place a duration inside a set of ranges. That is where the problem lives — not in the wording of any question, but in the ranges themselves.
The flaw I kept pulling on
Question 1 asks for your lead time for changes and offers, among others: One to six months, One week to one month, and One day to one week.
Read the boundaries. A team whose average lead time is exactly one week fits both One day to one week and One week to one month. A team at exactly one month fits both of the upper two. The ranges do not partition the timeline; they overlap at every seam.
Survey research describes answering a question as a sequence: understand the question, recall the relevant information, form a judgment, then select the option that best represents that judgment. The first three steps here are easy. A developer knows their lead time is about a week — that is a fact they live with. It is the fourth step that fails. The instrument asks them to report a number, then gives them nowhere to put it.
So they interpret. Some read one week as the ceiling of the lower band. Others read it as the floor of the upper one. Both are defensible, which is the problem: two developers on the same team, with the same one-week lead time, can honestly select different answers.
That spread is not signal. It is measurement error wearing the costume of performance variance. And because the score is normalized and benchmarked, the error does not stay put — a team can land in a better or worse band than its actual delivery performance, purely on how its respondent resolved an ambiguity the instrument created.
| Metric | Elite | Low |
|---|---|---|
| Deployment frequency | On-demand, many per day | Once every 1–6 months |
| Lead time for changes | Less than one day | One to six months |
| Change failure rate | 0–15% | More than 1 in 3 |
| Recovery from failure | Under one hour | More than six months |
The part my critique did not cover
The assignment asked for one issue in depth rather than many lightly, so I wrote up Question 1 and stopped. Reading it again against the screenshot, the honest note is that Question 1 is not the only place this happens.
Question 4 — failed deployment recovery time — uses the identical scale. Same overlapping boundaries, same one-week ambiguity, same downstream effect on the score. Question 2 collides too, more quietly: Between once per day and once per week and Between once per hour and once per day both accommodate a team deploying exactly once a day.
Three of four questions share the defect. Only the slider escapes it.
I do not think going deep on one was the wrong call — it was the acceptance criterion, and it is the criterion that produced the argument. But the gap between the two is familiar from my actual job: a deep test on one path and a shallow sweep across all of them find different bugs, and a report that does not say which one it ran is hard to act on. Mine went deep. So this is the coverage line it owes: the pattern repeats, and a fix applied only to Question 1 would leave two-thirds of the defect in place.
And that is still only the response scale. The sample the whole benchmark rests on has defects of its own, none of which my critique touched:
Self-selection
The teams that answer a delivery survey are the teams already tracking delivery. A team that can't say how often it deploys never fills in the deploy-frequency box.
Self-report, not measured
"On-demand" is a respondent's claim, not a pipeline's log. Every one of the four numbers arrives as memory and hope, not as instrumentation.
Survivorship
Cancelled projects and burned-out teams don't return the form. The band distribution is drawn from the survivors, then quoted as if it were everyone.
The fix I proposed
The repair is cheap, which is what makes it worth writing down:
- Redesign the ranges so the cutoffs are explicit and non-overlapping — Less than 1 day, 1 day to less than 1 week, 1 week to less than 1 month, 1 month to 6 months. Every possible value now lands in exactly one box. Nothing about the tool’s speed changes.
- Apply it to all three duration questions, not just the one I wrote up.
- Cognitively test the revision before deploying it. Watch a handful of engineers answer out loud and confirm the new boundaries match how they actually think about delivery timelines. This is the step that separates a scale that reads clean from a scale that is clean.
My verdict: a genuinely useful instrument with a real research program behind it, and a response scale that undercuts the precision its own benchmark implies. Not a reason to stop using the Quick Check — a reason to stop reading small differences in its score as real.
Why this one stayed with me
The tool promises a benchmark in under a minute, and I think the speed is not incidental to the flaw. It is upstream of it. Broad, round, overlapping buckets are exactly what you reach for when the design goal is fast — they feel generous, they let everyone find something close enough, and nobody bounces out of the survey. The ambiguity is not a defect in a fast instrument. It is part of how the instrument gets to be fast.
That is the version of this I keep thinking about, because it is not really about DevOps metrics. Any time you make it easier to answer, you have to ask whether you made it easier to answer accurately or just easier to answer at all. Those two come apart more often than they should.
Holds
The two-axis model — speed and stability move together rather than against each other.
The bands give teams a shared vocabulary for a conversation they used to have with adjectives.
"Recover fast" is a first-class goal, not an afterthought.
Tempered
Self-reported bands are claimed, not measured — treat them as a starting hypothesis.
The sample skews toward teams already winning the thing being measured.
A benchmark quoted out of its sample is a script pulled out of the sandbox it was validated in.
And it lands close to home. Negotiating for clarity is what I do when a category does not fit me and I have to choose one anyway — pick the nearest word, take the correction, keep going. A response scale that forces interpretation instead of reporting is asking every respondent to do that small translation, and then treating the results as if nobody had to. The people most fluent in fitting themselves into approximate boxes are the least likely to flag that the box was wrong.
Thanks for reading. One question if you own a metric your team gets measured against: do you know whether the spread in it is your teams differing — or your instrument’s boundaries being ambiguous enough that identical teams answer differently?
Comments