Disclaimer: The views on this site are entirely my own and do not represent those of any employer, past or present. This post reflects on graduate coursework. Nothing here is medical, fitness, or training advice.
A statistics mission with a fitness dataset attached: plot two exercises against each other, compute the relationship, say what it means. I got the coefficient right to seven decimal places and justified it with a sentence that was not evidence of anything.
A wrong answer gets caught. A right answer with a bad reason behind it does not — nothing downstream complains, the box gets ticked, and the reasoning survives to be used again on a case where it will quietly fail.
I found one of mine sitting in an assignment I had been pleased with.
The mission
The brief was one sentence:
“You are a researcher who is interested in exploring whether there is a relationship between how much of a certain type of exercise a person can do.”
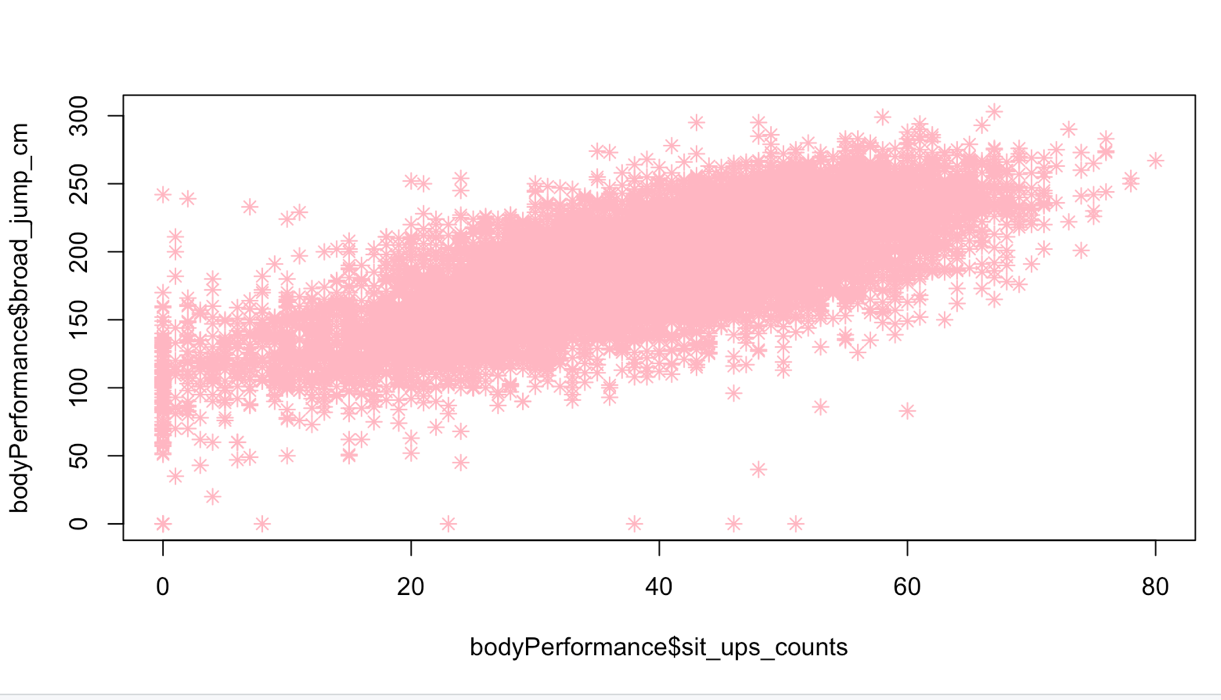
Two variables from a body-performance dataset of 13,393 people: sit_ups_counts, measured in repetitions, and broad_jump_cm, measured in centimetres. The first task was to plot one against the other.
The answer that was right
The second question asked for a reading of the picture alone:
“In the scatterplot generated in question 1), is the correlation positive, negative, or zero? Based on findings from the shape or pattern of the visualization alone, how do you know?”
What I submitted:
“From the scatterplot’s visual pattern, it appears that there is a positive correlation between sit_ups_counts and broad_jump_cm, as the data points seem to cluster in the first quadrant, suggesting a positive covariance.”
The conclusion is correct. The justification is not a justification.
Sit-up counts cannot be negative. Jump distances cannot be negative. Every point in that plot was always going to land in the first quadrant, and that was settled by the units before anyone measured anybody. Had sit-ups and jump distance been strongly negatively related, or not related at all, the points would still have been in the first quadrant. I had cited a fact about the axes as evidence about the data.
What actually signals a positive relationship is the slope of the cloud — move right along the x-axis and the body of points rises. That is plainly there in the plot. It is what I was really seeing. It is not what I wrote down.
There is a second thing in that image I said nothing about: a scatter of points sitting flat on zero centimetres, spread across the whole range of sit-up counts. A broad jump of exactly zero is not a jump; it is a missing measurement wearing a number. My instinct is that a dozen stray rows cannot move a coefficient built from 13,393 of them — and that instinct is the same species of error as the first one. I have not rerun the correlation with those rows dropped. Until I do, “they don’t matter” is a reason I like, not a result I have.
And a third problem, also mine: 13,393 opaque asterisks turn the middle of the distribution into a solid block of colour. Whatever lives in there — a second cluster, a bend, a gap — is painted over. Transparency, or a density plot, would have shown it. I described that region in my answer as though I could see into it.
What the number is made of
The mission made me build the coefficient by hand before allowing me cor(), and that order turned out to be the useful part.
Two quantities carrying units, one carrying none. The division is the whole trick.
425.9045
sample covariance, in count · cm
Correct and unreadable. Nobody has an intuition for a count-centimetre, and the value would change if jumps had been recorded in metres.
÷ 569.1834
14.2767 counts × 39.868 cm
The two standard deviations multiplied. Same units as the covariance, which is exactly why they cancel.
0.7482728
r — no units left
Bounded by −1 and 1, and therefore comparable across any pair of variables in any dataset. My hand calculation gave 0.7482728765; cor() gave 0.7482728.
The rubric attached to the assignment called 0.75 strong, and I wrote that down too. It is worth being clear about what that word is: a convention for talking about the scale, not a measured property of sit-ups.
Strong is not the same as explanatory. Squaring the coefficient gives the share of variation the two variables hold in common — here about 0.56. So even at the top of the rubric, roughly 44% of the variation in how far these people jumped has nothing to do with how many sit-ups they managed.
Linear is an assumption, not a finding. The coefficient measures straight-line association. A genuinely strong curved relationship can return a number near zero, and I would have reported “no relationship” without ever having looked. Plotting first is not a courtesy to the reader; it is the step that tells you whether the number you are about to compute means what you think it means.
The four readings I owed the data
Then the interesting sentence arrived on its own, before I had decided to write it: sit-ups build jumping power. It has a recommendation attached, and a recommendation is what makes an analysis feel like it mattered.
All four produce 0.7482728. Nothing in this dataset chooses between them.
Sit-ups → jump
Core endurance transferring to explosive lower-body work. The reading I wanted, and the only one with a training programme attached. It is one of four, and the design gives it no special standing.
Jump → sit-ups
Reverse order. Neither test is obviously upstream of the other, and a single assessment session records both at once, so the data carries no information about which came first.
Something else drives both
Sex is the obvious candidate: men average higher on both tests, so pooling everyone lays two offset groups along one diagonal, and a pooled coefficient can sit above what either group shows on its own. Age, body composition and training volume all work the same way.
Who got measured
People who turn up for a fitness assessment are not people in general. Chance is a poor explanation at 13,393 rows; selection is not, and no sample size fixes it.
That last comparison is the one that stopped me. I would not accept, from anyone on my team, a root-cause analysis that listed four possible causes and then wrote up the most convenient one as the finding. I would send it back. Here I was doing it to myself, with the added protection that nobody would check.
The columns I had and didn’t use
None of that is hypothetical for this dataset. The same frame carried age, height, weight, body-fat percentage and grip strength — the supplementary code for the mission walks through several of them — and it records each participant’s sex. Splitting the plot on any one of those is one extra argument to the plotting function and about thirty seconds of work.
I did not do it, and the mission did not ask me to. Both of those are true; only the first is mine. There is a name for what I was risking: aggregation bias, where a relationship computed across pooled groups describes the pooling as much as the thing being measured. A coefficient over a mixed sample answers a question about the mixture. I never asked whether the parts agreed with it — and that question is the difference between a coefficient and an explanation.
The verb is where the claim lives
Four sentences I drafted for the write-up, and what each one actually claims.
| Draft sentence | Verdict |
|---|---|
| "Sit-ups build jump distance." | A causal claim, unsupported by a design where both tests were measured on the same afternoon. This is the sentence I wanted. |
| "More sit-ups lead to longer jumps." | The same claim in softer clothes. "Leads to" is causal; hedged phrasing does not change the logic. |
| "Sit-up count predicts jump distance." | Defensible if prediction is all that is meant — and it predicts a little over half the variation. Most readers hear causation anyway, so it needs the limit stated beside it. |
| "Sit-up count and jump distance are associated, r = 0.75; the design cannot establish direction." | Supportable. Duller by one verb, and the only one I could defend if questioned. |
What would have earned the causal sentence
The useful move is not to drop the causal question — it is a good question — but to state what evidence would settle it.
A randomised block of sit-up training, with jump distance measured before and after, would do it directly. Short of that: a longitudinal design that establishes which changed first, or a multivariable regression that adjusts for the covariates already sitting in the frame — while being honest that adjustment only ever handles the confounds I thought of.
Writing that paragraph took ten minutes and was the most valuable part of the assignment. It turns “I can’t say this” into “here is what it would take to say this,” which is the shape a limitation should have in any report.
What I took away
Two checks, both mechanical, because the noble version does not survive a deadline.
When an answer is right, test the reason separately. Ask whether the reason you gave could have produced the same sentence had the data come out the other way. Mine could: “the points cluster in the first quadrant” would have been equally true of a negative relationship, or of no relationship at all. A reason that survives every outcome is not a reason. In QA this has a familiar name — a test that passes for the wrong reason is still green, and green is the only thing anyone downstream reads.
Before any claim goes out, check the verb. If it implies direction, ask what in the design established the direction. If the answer is nothing, change the verb. It costs about four seconds and it catches the one error I know I am prone to.
Thank you for reading. If you want to try the first check on something of your own: take the last result you got right, and ask whether the reason you gave for it would still have been available to you had the data come out the other way.
Comments