What follows is a walk-through of a graduate applied-statistics assignment built on a real survey: Open Sourcing Mental Illness’s Mental Health in Tech dataset. The motivations and interpretations quoted are my own, submitted before I’d run a single cross-tabulation.
Workplace mental health is close enough to my own day job that I read this assignment differently from the others. It’s not an abstraction — stigma, disclosure, geography, and policy are all things I’ve watched play out in real teams. So when the assignment asked me, before I’d touched a row of data, to explain in under 250 words why a study like this would even get funded, I wrote what I actually believed. Then the data made me check whether I’d earned the right to believe all of it.
The sample, before any of the claims
Four properties of this dataset. Only one of my three motivations needed the fourth — and that is the one that failed.
The survey
Open Sourcing Mental Illness's Mental Health in Tech survey — attitudes toward, and prevalence of, mental health conditions among tech workers. Public dataset, real respondents, not a teaching toy.
The design
Observational. Nothing was manipulated, nothing was assigned, and no sampling frame governs who appears. Respondents selected themselves in — including which country the response came from.
The shape
The variable the assignment actually asked about — remote work status:
No · 70.3% · ~880 respondents
Yes · 29.7% · ~370 respondents
The reach
47 countries appear in the legend. Over 90% of responses come from five of them — Germany, USA, Australia, UK, Canada.
The other forty-two arrive in handfuls, and several arrive alone.
The assignment, and what I said mattered
The dataset is real: the OSMI Mental Health in Tech Survey, collected by Open Sourcing Mental Illness to measure attitudes toward and prevalence of mental health conditions among tech workers. Before any analysis, the assignment asked for motivation:
In under 250 words, provide three potential motivations (e.g., medical, financial, legal, etc.) behind why this study could have been conducted and who could benefit from the findings.
My answer, submitted verbatim:
1) Social Reasons: The stigma associated with poor mental health persists in personal and professional lives in many social settings. This study appears to be investigating with the purpose of improving mental health in the workplace by attempting to examine the existing condition of mental well-being in the technological workplace… This study can help employers and employees enhance mental health support efforts.
2) Examine Healthcare Disparities Across Geographies: Although certain countries are more represented in terms of responses than others, studying differences in terms of mental health attitudes and diseases might provide us with targeted mental health interventions. The data may benefit/assist mental health practitioners in identifying individuals who may be at higher risk…
3) Legal Reasons: This data can help policymakers and advocacy groups assess workplace punishments, rewards, and leave policies, and urge for more major legislative initiatives to promote mental health aid for workers.
Read that second motivation again — I already flagged, in the same sentence, that “certain countries are more represented… than others.” I noticed the caveat and wrote past it anyway, because the point I wanted to make about geographic disparity was worth making. The data hadn’t let me down yet. It was about to.
The setup work
The assignment first asked me to classify three variables, which is duller than it sounds and matters more than it sounds:
- Country — categorical, nominal. No ranking between countries, just group membership.
- Age — quantitative, ratio. A true zero (birth), meaningful differences and ratios.
- Work_Interference — categorical, and I flagged it as carrying real ordinality (how much a condition interferes with work — never, rarely, sometimes, often) even while treating it as ordinal-categorical rather than quantitative, because the gaps between “rarely” and “sometimes” aren’t a measured, equal distance the way years of age are.
Then the study design question, which is the one that should have primed me harder than it did:
Was the study design experimental or observational?
Based on the absence of manipulations, it can be inferred that this study falls under the category of observational research rather than experimental research.
Observational data, self-selected respondents, no random sampling frame across countries. I wrote that sentence and then, two motivations earlier, had already reached for a cross-national claim anyway.
What the data actually showed
The assignment’s first real analysis was simpler than “healthcare disparities across geography” — a single categorical variable, remote work status:

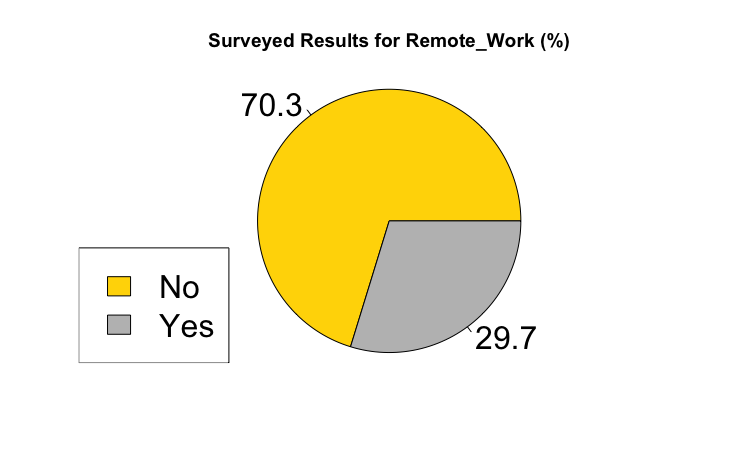
Straightforward — 70.3% office, 29.7% remote, double the office workers to remote ones. Nothing about geography yet. That came next, when the assignment asked for a contingency table and a mosaic plot crossing remote work status against country:
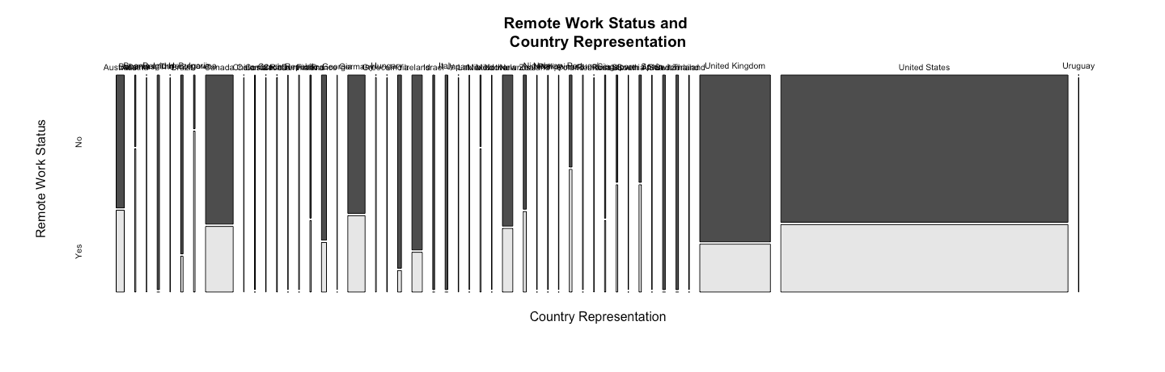
Figure 1 · post-mortem
The plot is not broken. That is the problem.
What a mosaic plot encodes
Strip width is group size. The split inside each strip is the second variable. Given two variables with a few balanced levels each, it is a genuinely good chart — you read proportion and prevalence in one glance.
What it does with 47 of them
Two strips — United States and United Kingdom — take most of the available width. The rest are hairlines, and their labels collide into a single smear along the top edge. For this chart to be readable, the imbalance would have to not exist.
This is the plot the assignment asked for, generated correctly, from real output. It’s also close to useless as a communication tool, and that failure is the finding. A mosaic plot encodes group size as strip width — which means most of the roughly forty countries in this survey are so thin they’re a hairline, their labels overlapping into an unreadable smear along the top, while two strips swallow most of the chart’s width. The plot isn’t broken. It’s accurately showing that “by country” is close to meaningless as a grouping here, and it’s showing it in the one format guaranteed to make that fact illegible instead of legible.
The bar chart underneath tells the same story without hiding it:
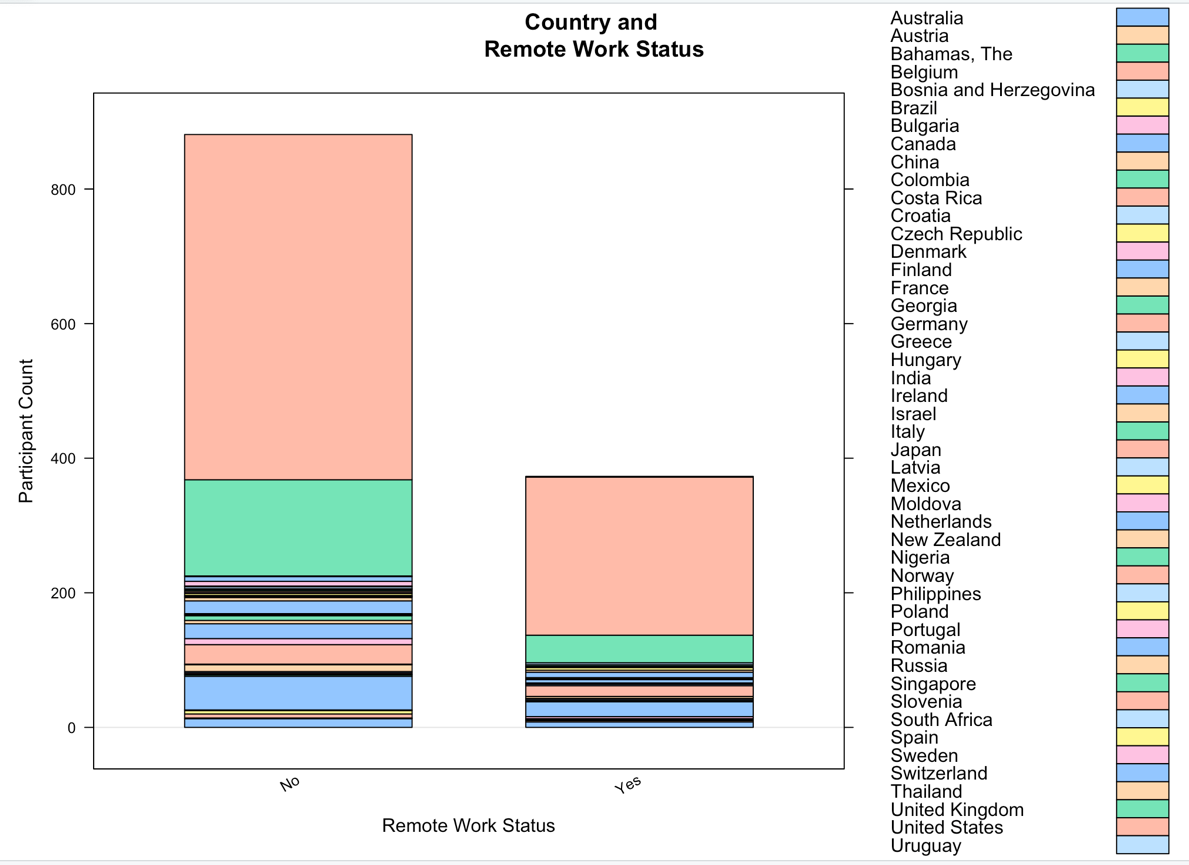
The written finding I submitted, plainly:
Many countries are included in this study, but over 90% of the study comes from five countries — Germany, USA, Australia, UK, and Canada. Out of all the countries, there are some countries with 0% working remotely.
That last clause is a tell I glossed over the first time I wrote it. “Some countries with 0% working remotely” doesn’t mean tech workers in those countries never work remotely — it means the survey collected so few responses from those countries that a single office worker was enough to produce a 0% remote-work statistic. That’s not a finding about a country. That’s a sample size of one wearing a percentage sign.
"Some countries with 0% working remotely"
One worked example, read straight off Figure 1.
What the plot shows
Far right edge, last strip alphabetically: Uruguay. Too narrow to have any interior structure at all — solid, top to bottom, on the office side.
What it reads as
0% remote work
in Uruguay
What it is
So few respondents that one person's commute settles the number. Had that same person answered "yes," the identical arithmetic would print 100%.
The stake I hadn’t earned
Motivation two, on the page before I’d run a single number: healthcare disparities across geography… targeted mental health interventions… practitioners identifying individuals at higher risk. That’s a real reason a study like this could matter, and it’s a real thing the underlying research area cares about. But this particular sample — over 90% of it concentrated in five high-income, majority-English-speaking countries, with dozens of others represented by a handful of respondents each — cannot responsibly be read as a geography study. Five countries sharing broadly similar labor-market and healthcare-system contexts is not global variation; it’s a within-cluster comparison wearing a world map’s clothing. Any claim about disparities across geography built on this dataset would be leaning almost entirely on the gap between five countries, dressed up as a statement about dozens.
The workplace-stigma motivation and the legal-and-policy motivation both survive this better — stigma and disclosure patterns can be meaningfully examined even within a US/UK/Germany/Canada/Australia-heavy sample, and policy questions about leave and workplace accommodation are directly answerable from exactly the countries best represented here. It’s the geography claim specifically that outran what the sample could carry, and I’d written it in good faith, one sentence after flagging the exact reason it wouldn’t hold.
Three stakes, audited against the sample that has to carry them
| What I claimed mattered | Can this sample carry it? |
|---|---|
| 1 · Social workplace stigma and disclosure | Yes. Stigma and disclosure patterns are measurable inside a US/UK/Germany/Canada/Australia-heavy sample. The claim never needed global coverage to begin with. |
| 2 · Geography healthcare disparities across countries | No. Five high-income, majority-English-speaking countries with broadly similar labour markets and healthcare systems is a within-cluster comparison wearing a world map's clothing — not global variation. |
| 3 · Legal leave, accommodation, workplace policy | Yes. Policy questions about leave and accommodation are directly answerable from exactly the countries best represented here. |
What transfers
I do inclusion work because I know what it costs to be underrepresented in a room, a dataset, a decision. It’s an uncomfortable thing to notice that my own instinct to write “healthcare disparities across geography” as a reason this study mattered came from a genuine, felt concern — and that the concern was real even though the specific dataset in front of me couldn’t back it up. Caring about representation and having a sample that represents are two different things, and conflating them is exactly how well-intentioned research ends up making claims on behalf of populations it barely sampled.
Negotiating for clarity, applied to my own paragraph: it’s not enough to name the right stakeholders and the right stakes. You have to go back, after you’ve seen the data, and check which of your stated reasons your specific evidence can actually stand behind — and say so plainly when one of them can’t.
Thanks for reading. If you’ve ever written the “why this matters” paragraph before you’d seen the data — a grant proposal, a project brief, a study motivation — it’s worth the discomfort of going back afterward and checking which sentence the evidence didn’t actually earn.
Comments